Sustainability & Energy
De-Icing Solutions for California Facilities: What Works
January 28, 2026
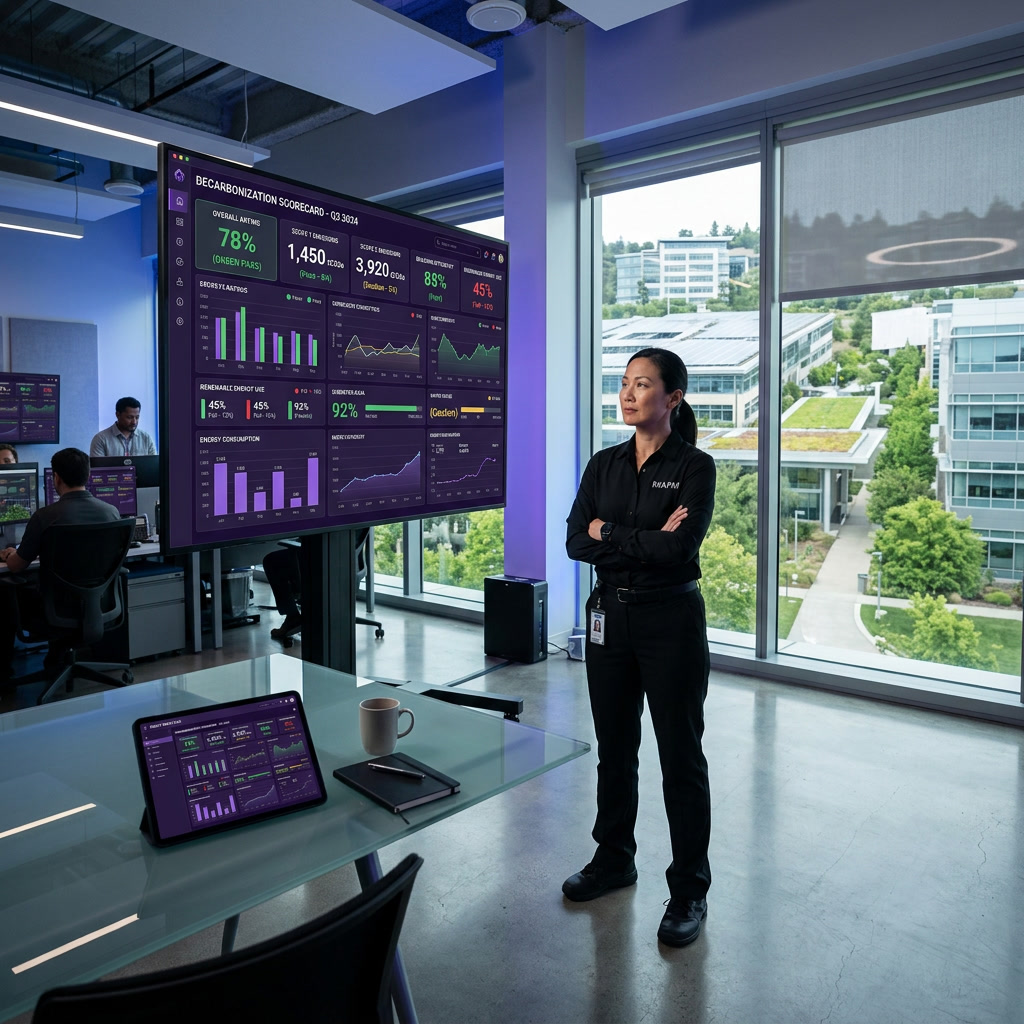
If you've been following this week's series, you've now got a pile of numbers: submeter readings, refrigerant leak logs, Scope 1 and 2 tallies, maybe a benchmarking score from Energy Star Portfolio Manager. That's the easy part. The hard part, the part that separates buildings that actually hit their 2026 targets from buildings that just measured how far they missed them, is turning that data into decisions before your Q4 board packet or your tenant's ESG questionnaire lands on your desk.
We spent this week walking through the individual pieces: how to audit HVAC and lighting loads for real reduction opportunities, how to track refrigerant compliance under California's evolving HFC rules, how to benchmark against BAAQMD and CEQA-adjacent reporting expectations, and how tenant behavior data changes your electrification math. Today we're closing the loop. This is the synthesis post: where those four workstreams converge into a single scorecard you can actually act on before year-end capital budgets close.
For most Silicon Valley commercial and mixed-use properties we service, the 2026 goal was never "net zero", it was a checkpoint: 20-30% Scope 1/2 reduction against a 2019 or 2020 baseline, tied to either a corporate ESG commitment, a green lease clause, or a municipal ordinance like San Jose's Building Emissions Reduction Ordinance. The question this post answers is simple: given everything measured this week, where does your building actually stand, and what are the three moves that matter most before Q1 2027 planning locks in.
The single biggest mistake we see facility teams make in Q4 is reacting to one metric in isolation. A property manager sees a 12% drop in electricity consumption and assumes decarbonization is on track: without checking whether that drop came from actual efficiency gains or from a tenant vacancy that's masking flat or worsening intensity per occupied square foot. Conversely, a spike in natural gas use during a cold snap can look like backsliding when it's really a one-time boiler recommissioning event.
The fix is a single consolidated tracker, not five spreadsheets living with five different vendors. Pull your utility data (electricity, gas, and if applicable, steam or chilled water), your refrigerant service logs from this week's HVAC audit, and your submeter or BMS trend data into one file organized by building, not by system. At minimum you want monthly kBtu/sqft, a refrigerant GWP-weighted leak rate, and a Scope 1/2 total in metric tons CO2e. If your property uses ENERGY STAR Portfolio Manager, its normalized metric, weather and occupancy adjusted, is the number that should drive decisions, not raw utility bills.
For a typical 150,000 square foot Class A office campus in Santa Clara or Sunnyvale, this consolidation exercise usually takes an FM team 15-20 hours the first time and under 5 hours each subsequent quarter once the template is built. That's a worthwhile investment given that most tenant ESG questionnaires and lender green-loan covenants now ask for exactly this normalized, multi-metric view: not a raw utility bill screenshot.
Across the portfolios we manage or consult on this quarter, three gaps show up again and again, and they map directly onto this week's topics.
First, refrigerant tracking is still treated as a compliance chore instead of a decarbonization lever. Under California's refrigerant management program requirements, buildings with larger charge systems already file leak inspection reports: but most teams don't convert leak rate into CO2e and don't realize that a 15% annual leak rate on an R-410A system can add more warming-equivalent emissions than a full year of a mid-size chiller's electricity draw. If your HVAC audit earlier this week turned up leak rates above 10%, that's not a maintenance footnote: it's your single fastest decarbonization win, because sealing leaks and recharging with lower-GWP refrigerant during scheduled service is cheaper than almost any electrification retrofit.
Second, benchmarking data is collected but not reconciled against the actual ordinance language governing the building. San Jose, Palo Alto, and unincorporated Santa Clara County each have slightly different reporting thresholds and deadlines, and several buildings we've reviewed this fall were benchmarking to a generic "green building" standard instead of the specific municipal requirement that actually applies to their address. That mismatch doesn't show up until a compliance letter arrives in Q1.
Third, tenant behavior data (plug loads, after-hours HVAC requests, EV charging draw) is collected by building engineering but never fed back into the electrification and capacity planning conversation. If tenant EV charging demand grew 30% this year (common in South Bay office parks), that's a load your electrical infrastructure plan needs to account for before you commit capital to heat pump conversions that might compete for the same panel capacity.
Once your data is consolidated and you know where the real gaps are, the roadmap exercise gets much more concrete. We recommend structuring it into three tiers based on capital intensity, because that's how most ownership groups and CFOs actually evaluate facility spend requests.
Tier one is no-cost or low-cost operational fixes you can implement in Q4 2026 without a capital request: recommissioning setpoints and schedules based on the tenant occupancy data from this week's audit, sealing refrigerant leaks identified in your HVAC assessment, and correcting any benchmarking submissions that don't match actual ordinance requirements. These typically cost under $15,000 per building and can move your normalized energy use intensity by 3-6% within one billing cycle.
Tier two is the 2027 capital plan: equipment nearing end-of-life that you were going to replace anyway, where the decarbonization decision is really about spec, not whether to spend. Rooftop units at 15+ years, boilers due for replacement, or lighting still on T8 fluorescent are natural electrification and efficiency insertion points. The key move here is sequencing: replace refrigerant-leaking equipment before pursuing new electrification projects that would add panel or transformer load, so you're not solving two capacity problems at once.
Tier three is the genuine capital ask (building electrification, on-site solar, battery storage, or full BMS replacement) that requires board approval, financing, or incentive stacking through programs like PG&E's commercial electrification rebates or the Bay Area Air Quality Management District's incentive programs. These decisions need the full consolidated dataset from Section 1 to build a credible payback case, and they're the ones that should be finalized in your Q4 capital committee meeting, not deferred into next spring when contractor and equipment lead times push installation past your 2027 compliance checkpoint.
Whether you're presenting to an ownership group, a corporate real estate committee, or a REIT asset management team, the meeting goes better with four specific artifacts rather than a narrative summary.
Bring the normalized energy use intensity trend line, at least trailing 12 months, with any anomalies (vacancy, weather, equipment failure) annotated directly on the chart rather than explained verbally: reviewers trust what they can see. Bring the refrigerant leak rate converted to CO2e alongside your electricity and gas emissions, so the full Scope 1/2 picture is in one number, not scattered across compliance filings. Bring a one-page tiered capital plan using the three-tier structure from Section 3, with tier one items already marked complete or in progress: showing momentum matters as much as showing the plan. And bring a compliance calendar showing exactly which municipal, state, or lender reporting deadlines apply to this specific property in Q1 and Q2 2027, since that's usually the question that ends the meeting.
Teams that show up with these four items typically get faster capital approval than teams that present a narrative sustainability report, because the stakeholders in these meetings are increasingly financial and legal reviewers, not sustainability generalists: they want the numbers pre-reconciled.
The properties that make real decarbonization progress aren't necessarily the ones with the biggest capital budgets: they're the ones whose facility teams close the loop between measurement and action every quarter instead of once a year. This week's series gave you the individual pieces: equipment audits, refrigerant compliance, benchmarking accuracy, and tenant behavior data. What turns those pieces into progress is exactly what we've walked through today: consolidation, gap identification, tiered planning, and a stakeholder meeting built around evidence instead of narrative.
If your building's 2026 numbers are sitting in five different files right now, that's the first thing to fix before year-end, not the last.
MAFM's sustainability operations team can consolidate your building's energy, refrigerant, and compliance data into a single Q4-ready scorecard and tiered 2027 capital roadmap: reach out before your next stakeholder meeting to see how your portfolio benchmarks.
Reference earlier in the week's posts on HVAC and lighting load audits, refrigerant compliance tracking under California's HFC rules, benchmarking against BAAQMD and municipal emissions ordinances, and tenant behavior data's role in electrification planning.
ENERGY STAR Portfolio Manager (energystar.gov/buildings/benchmark) for normalized energy use intensity tracking; Bay Area Air Quality Management District's commercial building emissions guidance (baaqmd.gov) for regional compliance thresholds.
MAFM offers comprehensive facility management solutions tailored to your business needs.
Get in Touch