Technology & Operations
AI Facility Management: What It Can Do for Response Times
January 21, 2026
The facility management KPIs worth tracking every month are the ones that tell you whether the building is being kept up, whether it is costing what it should, and whether the people in it are satisfied and safe. Ten metrics cover that: four on operations, three on money and energy, and three on tenants and safety.
None of them needs special software. Most come from data you already hold in work orders, inspection forms, invoices and utility bills. What takes discipline is defining each one in writing, calculating it the same way every month, and reading the trend instead of a single month.
Start with the ten below, then drop or add based on what your building and your owner care about. A KPI earns its place only if someone will act when it moves.
Two rules keep a KPI list honest:
These four measure whether the day-to-day work is happening to standard.
Inspection pass rate is the share of scheduled inspections that meet your written standard. Calculate it as inspections passed divided by inspections completed, as a percentage.
It is the most objective quality measure you have, because you set the standard and you observe the result. Complaint counts depend on whether occupants bother to report. Track it by area (restrooms, lobbies, kitchens, floors) so a weak spot does not hide inside a healthy average. The threshold that counts as a pass belongs in the inspection checklist; set it with your service provider and hold it steady.
On-time completion is the share of work orders closed within their target time, calculated separately for urgent and routine requests. A blended number lets a pile of easy routine tickets hide late urgent ones.
Set the target by priority class in a service level agreement, such as a leaking ceiling versus a squeaky door. Define "complete" as the requester confirming the fix, not the technician closing the ticket.
This is the share of maintenance work that comes from your preventive program versus breakdowns and emergencies. Calculate it as planned work orders divided by total work orders, or by labor hours if you track them.
The U.S. Department of Energy's O&M guidance, as summarized by Pacific Northwest National Laboratory, estimates that a preventive program saves as much as 12% to 18% on average compared with a purely reactive one. The same page gives a table adapted from the Federal Energy Management Program's 2010 guidance: a typical industry range of 40% to 60% reactive work, against less than 10% for best-in-class programs (PNNL, O&M Best Practices: Maintenance Approaches). Those are federal facility figures, so treat them as direction, not a pass mark for an office tower. The useful signal is your own trend: reactive share falling means the program is working. See our guide to preventive maintenance programs for how to build one.
Response time is the elapsed time between a request and the first meaningful action, whether that is an acknowledgment, a dispatch or an arrival. Report the median and the ninetieth percentile by priority class, because averages hide the outliers that tenants remember.
There is no universal standard for response time, and the right target depends on what the request is. Measure acknowledgment and resolution separately: a fast reply that is followed by a three-week wait still feels slow.
These three measure whether the building is efficient and predictable.
Cost per square foot is annual facility cost divided by the building's maintainable area. The total alone is not much use, so split it into components. The U.S. General Services Administration tracks building operating cost in dollars per rentable square foot, broken out for mechanical operation and maintenance, for cleaning, and for utilities (GSA, Evaluating high-performance buildings).
Copy that structure. When the total moves, the breakdown tells you whether cleaning, repairs or utilities caused it. Compare against buildings of similar age, size and service level, and note that a lower number is not automatically better if inspection pass rates are falling at the same time.
Budget variance is actual spend minus budget, divided by budget, as a percentage. Report it by category each month, not only in total, so an overrun in one line is not hidden by savings in another.
Agree the acceptable range with ownership in advance. A swing tied to a known event, such as an emergency repair, should be annotated rather than explained away. The goal is a forecast owners can trust, which matters more than hitting zero.
Energy use intensity (EUI) is the building's energy use per square foot per year. ENERGY STAR defines it as total energy consumed in a year, in kBtu, divided by gross floor area, and notes that a low EUI generally signals good energy performance (ENERGY STAR, What is Energy Use Intensity).
For a reference point, ENERGY STAR's August 2024 national table, built from the federal Commercial Building Energy Consumption Survey, lists the median office at 52.9 kBtu per square foot of site energy and 116.4 of source energy (ENERGY STAR, U.S. Energy Use Intensity by Property Type). That is a national figure, not adjusted for climate or use, so a data-heavy tenant floor or a mild coastal climate will shift where your building sits. Track your own year-over-year change.
In California, owners of commercial buildings over 50,000 square feet must report energy use annually, by June 1, through ENERGY STAR Portfolio Manager (California Energy Commission, Building Energy Benchmarking Program). If that applies to you, you are already collecting this data.
These three measure what people in the building experience.
Tenant satisfaction is the average rating from a short, repeated survey. GSA's tenant survey uses a 1 to 5 scale for indoor air quality, noise, temperature, cleanliness, light and overall satisfaction (GSA), which is a good template: a handful of specific questions beats one vague one.
Survey on a fixed schedule, keep the questions the same so scores compare over time, and close the loop by telling tenants what changed. Our post on measuring tenant satisfaction covers the method.
Complaint rate is complaints per month divided by occupied area, scaled to a round unit such as per 10,000 square feet so buildings of different sizes can be compared. Break it down by category and by location.
Complaints are an early warning, because they usually rise before survey scores fall. A rate that doubles in one wing points to a specific cause. Count a repeat complaint about the same issue separately from new ones, since repeats mean the first fix did not hold.
Safety incident rate tracks injuries and near-misses among the people who maintain and clean the building, and slips, trips and hazards reported by occupants. For staff injuries, use the standard incidence formula: cases multiplied by 200,000, divided by hours worked, which expresses the rate per 100 full-time workers (BLS Handbook of Methods).
The target is zero, but a rate alone is a lagging measure. Track near-misses and hazard reports as well, and investigate each one. Many near-misses, such as a wet floor or an unguarded cart, can be fixed before anyone is hurt.
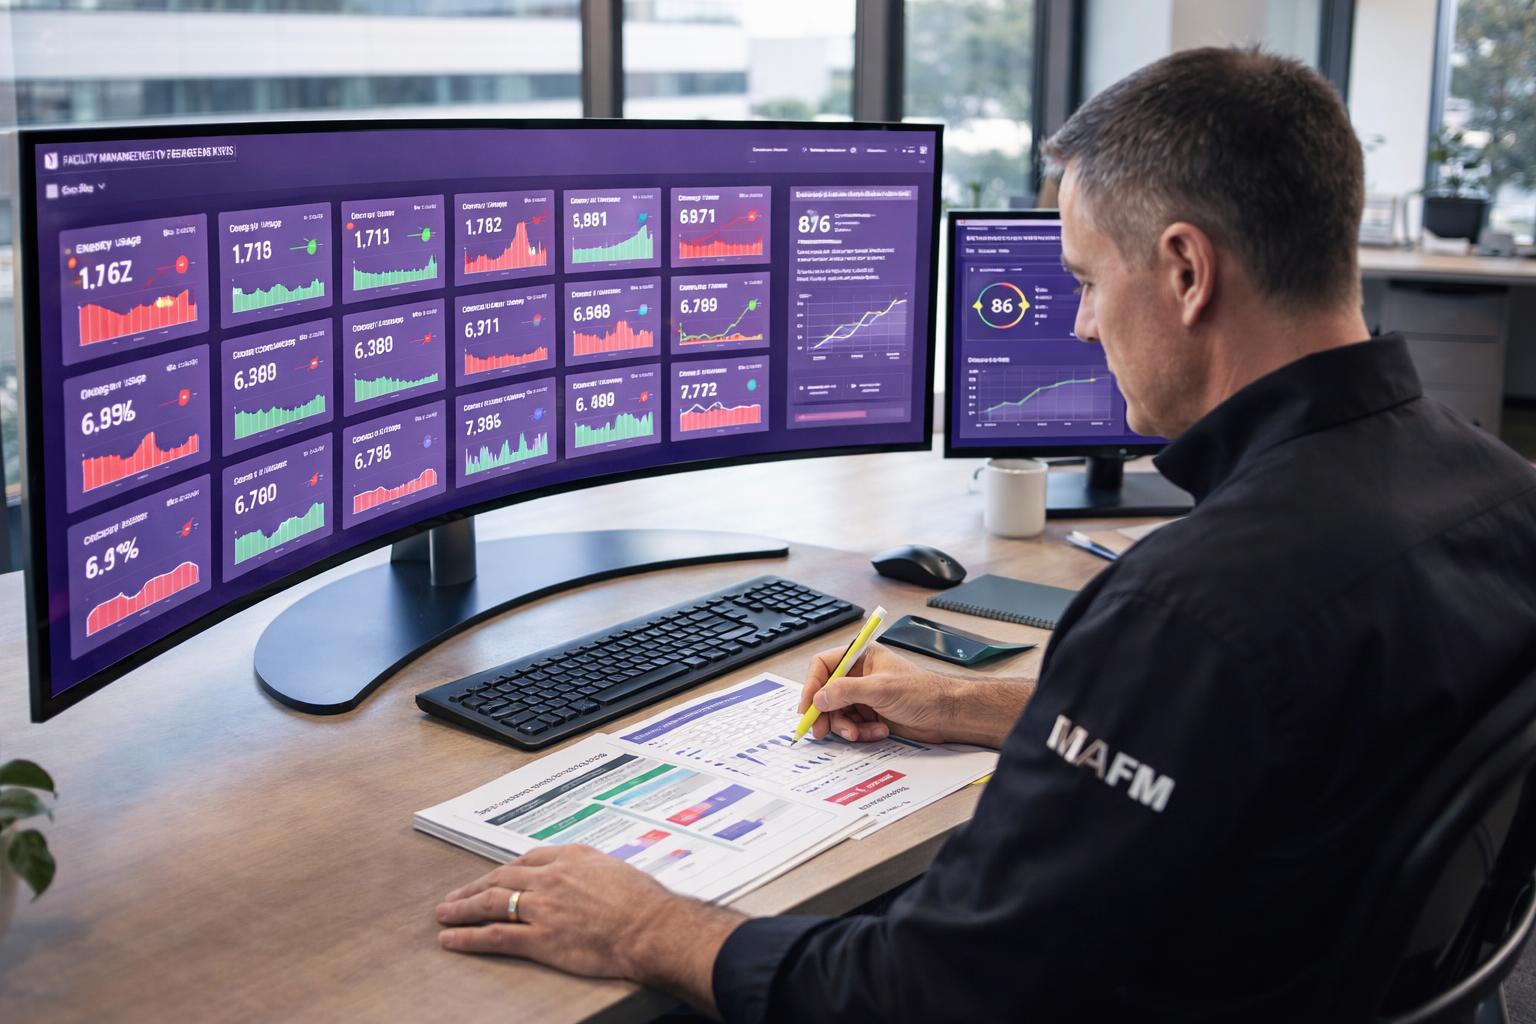
Put all ten metrics on one page, each with the current month, the trailing 12-month trend and a status color against thresholds you have agreed. If it needs scrolling or extra tabs, it will not be read.
A few habits make the page useful:
How many facility management KPIs should we track? Ten is a practical ceiling for a monthly review. Fewer, well-defined metrics that people act on are better than a long list nobody reads, and you can add a metric when a specific question demands it.
What is a good benchmark for facility management KPIs? Few reliable public benchmarks exist. For maintenance mix, PNNL's summary of federal guidance gives ranges, and for energy, ENERGY STAR publishes national medians. For the rest, set your own baseline in the first three months and track improvement against it.
How often should facility KPIs be reviewed? Monthly for the dashboard, with weekly attention to work orders and safety reports. Energy and budget metrics need a full month of bills, and trends mean more than any single month.
Who should own the KPIs? One named person, usually the facility manager, owns the dashboard, while each metric has an owner who explains it. When a service provider runs part of the building, put the reporting requirement and the definitions in the contract.
A KPI list only helps if the data is collected consistently and reviewed with the people who can act on it. MAFM is a facilities management company, and we plan, schedule and coordinate building services and the vendors behind them, with reporting built around the metrics your owner cares about. Talk to us about facility management if you want a monthly dashboard set up and run with you.
MAFM offers comprehensive facility management solutions tailored to your business needs.
Get in Touch