Budget / Finance
When the Capex Plan Meets Reality: Reallocating Capital Budgets Mid-Year Without Losing Ownership's Trust
August 20, 2026
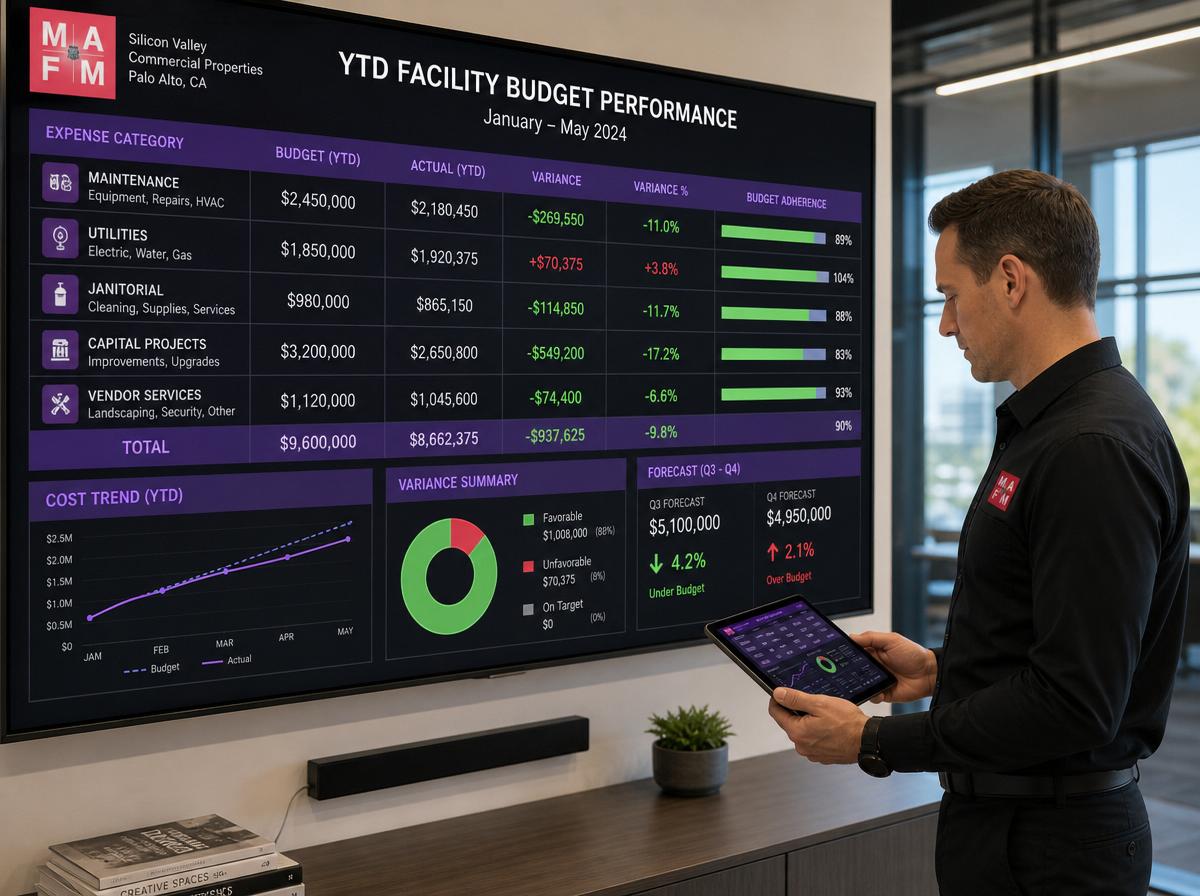
By the last week of May, you have five months of 2026 operational data, enough to run a genuinely meaningful financial performance review that goes well beyond comparing budget-to-actuals line by line. Five months of data reveals spending trajectories, system inefficiencies, vendor cost drift, and utilization patterns that January projections could not have anticipated. It is also, critically, the last window in which corrections made today meaningfully affect full-year outcomes.
The mid-year facility budget review is not the same exercise as the quarterly budget check-in. Where quarterly reviews address individual period variances, the mid-year review assesses full-year trajectory, projecting where your spending will land in December based on current patterns and identifying the specific corrections that close the gap between where you are heading and where your budget says you should arrive.
Here is the financial performance framework that converts five months of actuals into a precise, correction-focused roadmap for Q3 and Q4.
The most important output of the mid-year review is not where you are, it is where you are going. Five-month actuals, annualized with seasonal adjustment, project full-year spending with reasonable accuracy for most budget categories.
The annualization methodology matters. Simple multiplication of five-month actuals by 2.4 to project the full year works for categories with flat spending patterns, cleaning supplies, routine maintenance, administrative costs. It produces distorted projections for categories with strong seasonal profiles (utilities, landscaping, HVAC maintenance) where the remaining seven months may look nothing like the first five.
Seasonal adjustment requires category-by-category analysis using the spending pattern your building has historically shown. A building where cooling-season electricity costs represent 60% of annual utility spending should project Q3–Q4 utility costs from historical peak-season data rather than from May actuals that reflect mild spring weather.
The adjusted full-year projection for each category produces one of three signals: tracking to budget (within 5%), tracking to favorable variance (more than 5% under), or tracking to unfavorable variance (more than 5% over). Categorize every budget line into one of these three buckets before doing anything else.
Favorable variances deserve scrutiny before celebration. A category running 15% under budget in May may reflect genuine efficiency improvement, in which case, great. It may reflect deferred work that will catch up later, in which case, the variance is illusory. Or it may reflect a change in service scope or quality that has not been captured in the budget, in which case, tenant experience may be degrading without a financial signal to alert you.
Unfavorable variances require root cause analysis before correction. The facility manager who responds to a utilities overage by reducing consumption targets without understanding why costs are elevated may reduce comfort while leaving the actual driver, a malfunctioning system running inefficiently, unaddressed.
Variances have causes, and the mid-year review is the moment to identify them with enough specificity to prescribe effective corrections.
Five categories of cost driver explain the vast majority of budget variances in commercial facility management.
Volume changes reflect the fact that the building's occupancy, square footage under management, or operational intensity changed from what the budget assumed. A tenant who expanded from two floors to three in March created cleaning, utilities, and maintenance costs that the original budget did not include. Volume changes produce legitimate variances that require budget amendment rather than operational correction.
Rate changes occur when the unit cost of labor, materials, utilities, or contracted services changes from the budgeted assumption. A janitorial contract that renewed at 8% above budget assumptions, an electricity rate increase mid-year, or a supply cost increase from your chemical vendor all create rate variances that require either contract renegotiation, supplier change, or budget adjustment.
Efficiency variances result from operational performance that differs from the productivity assumptions embedded in the budget. A night cleaning crew that consistently requires overtime to complete its scope is generating an efficiency variance, either the scope exceeds the budgeted production assumption, or the crew is underperforming against the budgeted productivity standard.
One-time events create period-specific variances that do not reflect ongoing spending trends. An emergency pipe repair in February, a roof patching project in March, and a security system upgrade in April all create variances against maintenance budgets that represent completed events rather than ongoing patterns.
Forecast errors occur when the budget assumptions were simply wrong, the estimate of how much a specific activity costs, how frequently a system requires maintenance, or what a new contract would cost did not reflect operational reality.
Beyond explaining variances, the mid-year review creates the analytical foundation for identifying cost optimization opportunities that the January budget process missed.
Vendor consolidation analysis examines whether your current multi-vendor structure is the most cost-effective approach. Buildings that have accumulated separate contracts for janitorial, day porter services, floor care, window cleaning, and specialty cleaning often pay a premium for fragmented scope that a single integrated provider would deliver more efficiently. Mid-year is the ideal time to model the consolidation opportunity and determine whether a procurement process makes sense before year-end.
Utility rate structure optimization verifies that your building is on the most advantageous rate schedule for its consumption profile. PG&E offers multiple commercial rate structures, and the optimal choice depends on your building's demand-to-consumption ratio, time-of-use consumption patterns, and participation in demand response programs. A rate structure analysis by your utility representative or an energy consultant at mid-year positions you to change rate schedules before the heating season changes your consumption profile.
Preventive maintenance return on investment analysis compares your PM spending against your reactive maintenance costs. If your PM program is performing correctly, reactive costs should represent less than 30% of total maintenance spending. A mid-year analysis that shows reactive costs tracking toward 45–50% of total maintenance reveals a PM program that is either under-resourced or not being executed as designed, and represents a cost optimization opportunity, since reactive costs consistently run 3–5 times higher than comparable preventive work.
Staffing productivity benchmarking compares your cost-per-cleanable-square-foot against current market benchmarks. If your staffing costs are running 15–20% above the $1.80–$2.80 benchmark range for Silicon Valley Class A office, you have either a staffing level issue, a compensation-structure issue, or a productivity issue, each with a different solution that mid-year data helps identify.
The mid-year review is the optimal moment for reserve fund assessment and capital planning adjustments.
Reserve fund adequacy review compares your current reserve balance against the capital needs your facility condition assessment identified. If your roof reserve target is 18 months of expected replacement cost and you have only 11 months of funding, mid-year is when to present the gap to ownership and initiate the discussion about reserve contribution increases before the need becomes urgent.
Capital project pipeline review validates that approved capital projects are on schedule, within budget, and still the highest-priority investments given what you have learned in the first five months. Projects that have experienced scope creep, contractor delays, or cost escalation should be reforecast now rather than surprising ownership at year-end.
Deferred maintenance tracking identifies any maintenance activities that have been pushed out of the current year schedule and assesses whether the deferral is intentional and acceptable or whether it represents risk accumulation that needs to be addressed.
Year-end project feasibility assessment evaluates whether any capital projects or major maintenance activities that were planned for Q4 remain achievable within the year given current project pipeline, contractor availability, and budget status. Projects that are no longer feasible within the year should be formally deferred to 2027 capital planning to prevent the rushed, quality-compromised execution that occurs when projects are attempted in December without adequate planning time.
The mid-year review is a stakeholder communication exercise as much as an analytical one. The rigor of the analysis matters; the clarity of the presentation determines whether it actually influences decisions.
Structure the communication as a one-page executive summary followed by supporting detail. The summary presents: full-year projection versus budget for each major category, the three to five most significant variances and their root causes, two to three cost optimization opportunities with estimated savings, and any capital or reserve fund issues requiring owner decisions.
Lead with the total facility cost picture before drilling into categories. Owners and asset managers need to know whether the building is performing within its financial parameters before they want to know which specific line items are variances.
Present unfavorable variances with both causes and responses, never present a problem without a proposed solution. A utility overage caused by a malfunctioning cooling system is a problem; a utility overage caused by a malfunctioning cooling system that has been identified, diagnosed, and is scheduled for repair next week is a managed situation. The difference in stakeholder confidence between these two presentations is substantial.
Present favorable variances with the same analytical honesty as unfavorable ones. "We are 12% under budget on maintenance because we deferred the lobby flooring restoration to Q4" is a more useful communication than "we are 12% under budget on maintenance." Honest favorable variance explanation prevents the budget-cutting conversations that assume efficiency gains are permanent when they may actually be temporary deferrals.
The mid-year facility budget review is the most consequential financial management activity of the year because it is the last moment at which course corrections materially affect full-year outcomes. October corrections reduce the Q4 overrun but cannot recover the prior six months. May corrections reshape the entire second half.
Execute your mid-year review this week. Run the trajectory projections. Identify the cost drivers behind every significant variance. Quantify the optimization opportunities. Assess reserve and capital adequacy. And present the findings to ownership with the clarity and confidence that professional financial management demands.
MAFM delivers rigorous mid-year financial performance reviews as part of our comprehensive property management approach. Contact us to see how transparent financial management improves building performance.
Schedule your consultation: Contact MAFM.PRO
MAFM offers comprehensive facility management solutions tailored to your business needs.
Get in Touch