Office Moves & Workplace
Tenant Satisfaction Surveys: How to Measure and Act
February 18, 2026
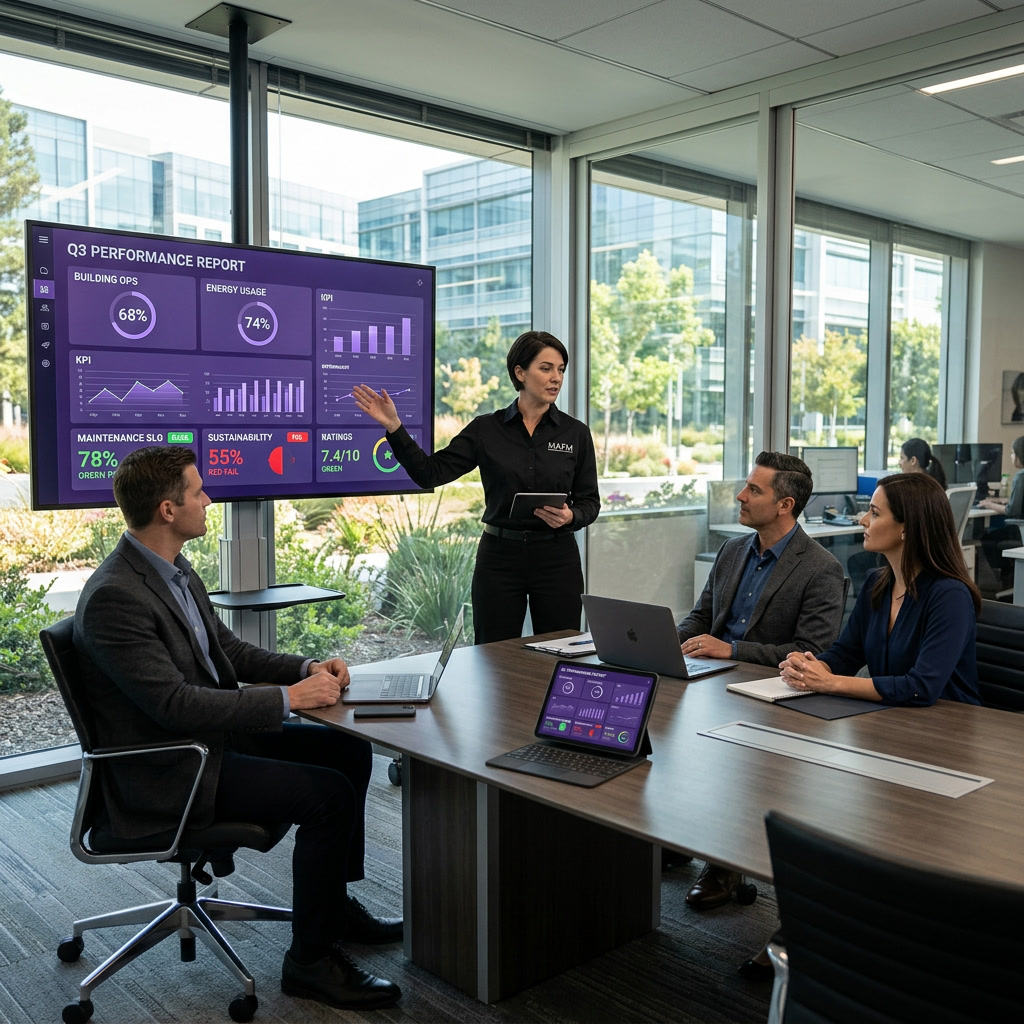
Every October, a familiar ritual plays out across Silicon Valley office parks, life sciences campuses, and mixed-use developments: facility managers assemble a Q3 report, ownership skims it in twelve minutes during a portfolio review call, and the conversation moves on to leasing and capital planning before anyone asks a follow-up question about the building itself. That twelve-minute window is either the moment an FM secures budget for next year's chiller replacement or the moment ownership quietly starts benchmarking against a competing vendor. The difference almost never comes down to effort. It comes down to what's actually on the page.
This week, MAFM is running a five-part series on Q3 performance reporting, built specifically for the operating realities of Silicon Valley commercial real estate: high-density campuses with mixed office, lab, and data center space, tenants with aggressive uptime expectations, and ownership groups increasingly staffed by people who came up through finance, not real estate operations. That last point matters more than most FMs give it credit for. A report written for a building engineer doesn't land the same way with an asset manager evaluating cap rate compression and NOI protection.
Over the next four posts we'll dig into tenant experience data, compliance and risk documentation, cost and vendor performance, and how to package all of it into a narrative ownership can act on. Today we start with the foundation: which numbers actually belong in a Q3 report, why most FM reports bury the metrics that matter, and how to structure the data so it reads as evidence of value rather than a maintenance log.
Walk into most quarterly ownership reviews across the Valley and you'll find the same document: a PDF heavy on work order counts, a paragraph about "preventive maintenance completion rate," and a line item budget variance table that nobody outside accounting reads closely. It's not wrong information: it's just the wrong altitude. Ownership groups managing a 280,000-square-foot campus in Santa Clara or a multi-building portfolio in Mountain View aren't trying to evaluate whether the HVAC techs showed up on time. They're trying to answer three questions: is this asset protected, is this asset costing us more than it should, and is the tenant experience strong enough to support renewal and rent growth.
The failure mode we see most often at client sites we've taken over from other providers is a report stuffed with activity metrics instead of outcome metrics. "147 work orders closed in Q3" tells ownership that people were busy. It doesn't tell them whether the rooftop RTUs at a 15-year-old building are trending toward failure, whether elevator downtime cost a tenant meeting the second week of August, or whether the janitorial contract is delivering the coverage hours it's billing for. Activity metrics protect the FM team's reputation for diligence. Outcome metrics protect the asset's value. Ownership needs the second category, and most reports simply don't include it because nobody built the tracking system to capture it in the first place.
The fix starts well before report-writing season. If your CMMS (computerized maintenance management system) isn't tagging work orders by asset criticality, by cost center, and by whether the trigger was preventive or reactive, you're reconstructing Q3 data from memory in September: and that's how reports end up generic. The teams that produce sharp quarterly reports are the ones logging the right fields in July.
Strip away the noise and every credible Q3 report for a Silicon Valley commercial property should cover five categories, each answering a distinct ownership question.
Asset condition and capital planning: What's the current state of major building systems (chillers, RTUs, boilers, elevators, backup generators) measured against expected useful life, and what's the 12-to-24-month capital forecast this quarter's data supports? Ownership wants to see remaining useful life estimates tied to actual runtime hours and maintenance history, not a generic "system is functioning normally" note.
Reactive-to-preventive ratio: This is the single number that best predicts next year's capital surprises. A property running above a 40% reactive maintenance rate is telling ownership that equipment is being run to failure rather than managed proactively: and that ratio should be tracked quarter over quarter, not just reported once.
Cost performance against budget, broken out by category: Utilities, janitorial, landscaping, security, and vendor contracts each need their own variance line, with a one-sentence explanation for any category more than 8-10% off plan. PG&E rate structure changes and demand charge shifts have hit Bay Area operating budgets hard through 2026, and ownership needs to see that variance explained rather than buried in an aggregate "operations" total.
Compliance and risk exposure: Fire/life safety inspections, elevator certifications, backflow testing, Title 24 energy compliance items, and any OSHA-relevant findings, reported as a status list with dates, not narrative prose. We'll go deeper on this in Wednesday's post, but ownership's risk tolerance for an open compliance item sitting unresolved into Q4 is essentially zero.
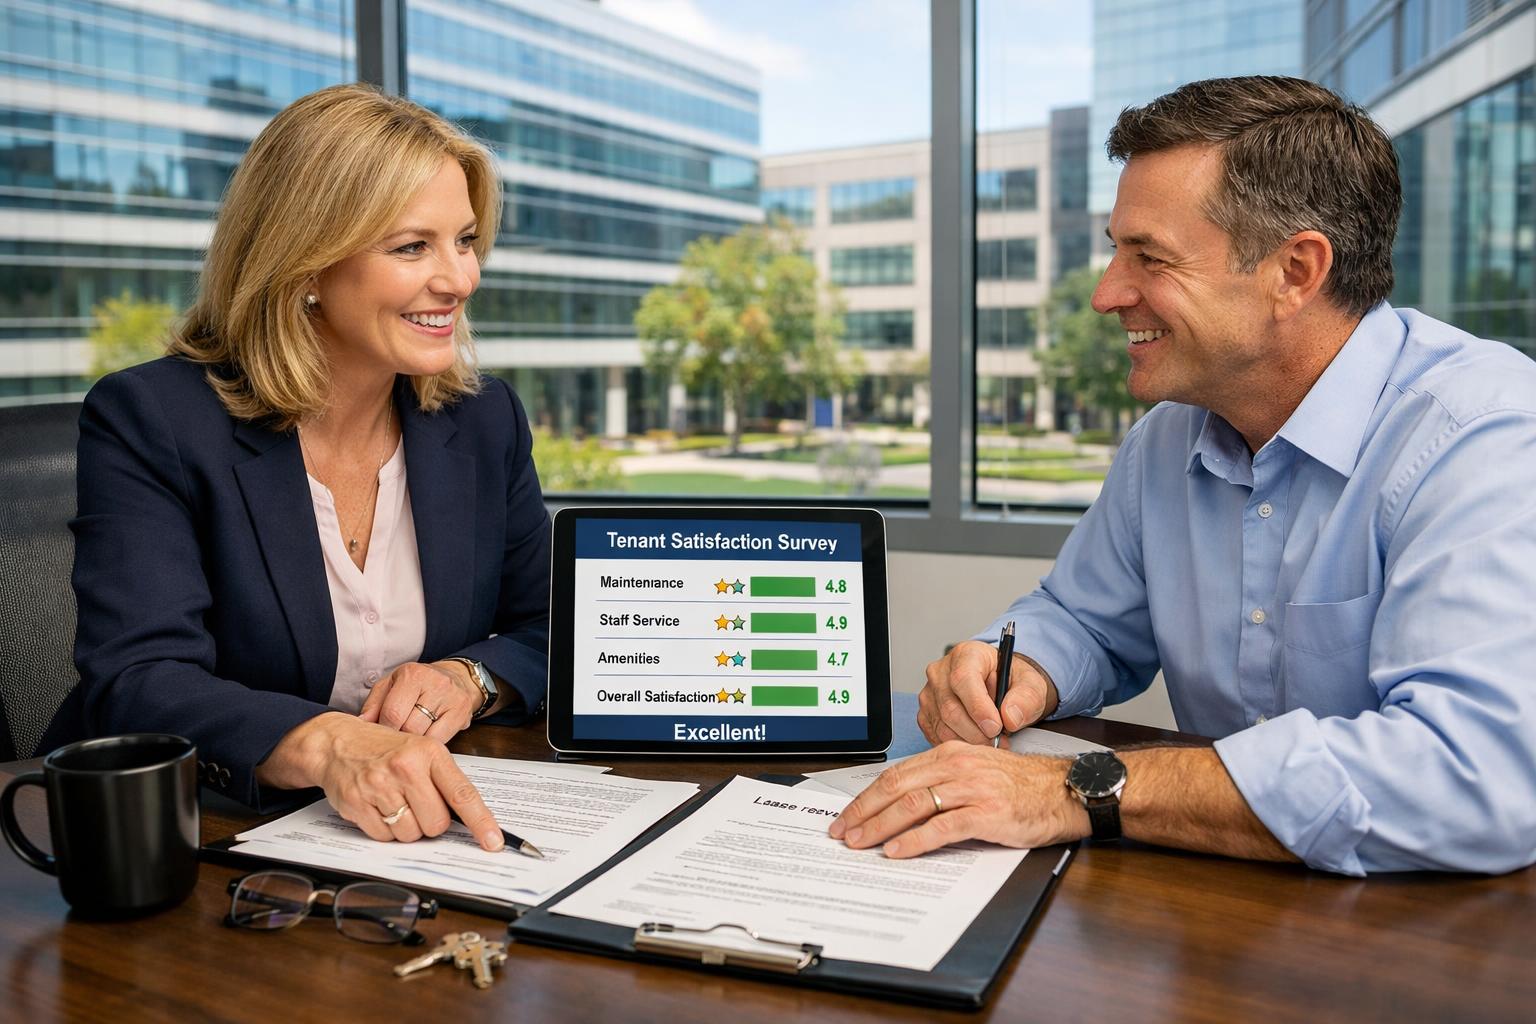
Tenant experience indicators: Response time to tenant-submitted requests, satisfaction survey results if available, and any pattern of complaints tied to a specific system or floor. A cluster of HVAC comfort complaints on the third floor of a building isn't just a tenant relations issue: it's often the earliest signal of a zone damper or VAV box failure that hasn't hit the work order system yet.
Generic FM reporting templates don't account for what makes Bay Area commercial operations distinct, and a report that ignores local context reads as outsourced and impersonal. Three conditions specific to this market deserve their own reporting lines.
Energy cost volatility and demand response participation. With PG&E's tiered commercial rate structures and time-of-use pricing, a property's Q3 utility performance should be reported against both budget and against the same quarter last year, adjusted for degree-days. If the property participates in a demand response program (and given California's grid strain during August and September heat events, more Silicon Valley properties are enrolling every year) the report should quantify the credits earned and the load-shed events executed. That's a line item ownership can show their own investors as evidence of active energy management, not just cost containment.
Lab and data center adjacency requirements. A growing share of Silicon Valley office product sits adjacent to or converted for lab and light industrial tenants with specialized HVAC, backup power, and environmental monitoring needs. If your property serves this tenant mix, Q3 reporting needs a dedicated section on backup generator testing cycles, UPS battery health, and any environmental excursion events, even minor ones, because these tenants' lease terms often carry uptime penalties that flow directly to ownership's liability.
Seismic and structural monitoring status. It's easy to let structural and seismic compliance items slide into an annual-only reporting cadence, but with California's ongoing updates to seismic retrofit ordinances affecting older commercial stock, ownership in this region increasingly expects a standing line confirming no change in structural risk status, even when the honest answer is simply "no updates this quarter." Silence on this topic reads as an oversight, not as good news.
The best data in the world gets ignored if it's formatted like an internal maintenance log. Ownership groups reviewing multiple properties in a single sitting need a report structured for fast scanning with drill-down available, not a linear narrative that has to be read start to finish to find the one number that matters.
Lead with a one-page executive dashboard: five to eight KPIs with quarter-over-quarter and year-over-year comparison, color-coded status (on track, watch, action needed), and a single paragraph flagging the two or three items that need an ownership decision this quarter, a capital request, a vendor change, a lease-related risk. Everything after that page is supporting documentation for someone who wants to go deeper, not required reading for the first pass.
Use consistent visual language across quarters. If Q2's report used red/yellow/green status indicators for compliance items, Q3 needs the same system, because ownership is pattern-matching across time, not evaluating each quarter in isolation. Switching formats between quarters, even when the new format is objectively better, resets ownership's ability to spot trends and makes the FM team look like it's still figuring out its own process.
Finally, every recommendation in the report should be tied to a number. "Recommend replacing RTU-3 in Q1 2027" is a request. "RTU-3 has logged 14 compressor cycling events in Q3 versus 3 in Q2, runtime hours are at 94% of manufacturer-rated life, and replacement cost today is roughly 30% below the projected emergency-replacement premium if it fails mid-summer" is a decision ownership can approve without a follow-up meeting.
A strong Q3 report doesn't just document what happened over the last three months: it makes the case for what should happen next, backed by numbers ownership trusts because the same numbers showed up, consistently formatted, in the last four quarters. Getting there requires building the tracking discipline into daily operations months before the report is due, not reconstructing a narrative in the final week of the quarter.
Later this week we'll dig into the tenant experience data that belongs alongside these operational metrics, the compliance documentation that protects both ownership and the FM team, and how to package cost performance data so it reads as value delivered rather than a bill. We'll close the week by tying all four pieces into a single reporting framework any Silicon Valley property can adopt for Q4 and beyond.
If your Q3 report is still built from a generic template or reconstructed from memory each quarter, MAFM can help design a reporting framework tied directly to your building's CMMS data: contact us to see a sample dashboard built for a Silicon Valley property.
References forward to this week's remaining posts on tenant experience metrics, compliance and risk documentation, cost and vendor performance reporting, and Friday's synthesis post tying the full Q3 reporting framework together.
IFMA's benchmarking research on facility performance metrics (ifma.org); PG&E's commercial rate and demand response program documentation (pge.com/en/save-energy-and-money/energy-management-programs.html) for context on Bay Area utility cost variance.
MAFM offers comprehensive facility management solutions tailored to your business needs.
Get in Touch