Supply Chain Cost Reduction for Facility Operations: How Silicon Valley Buildings Cut Supplies Spending by 20-35% Without Cutting Quality
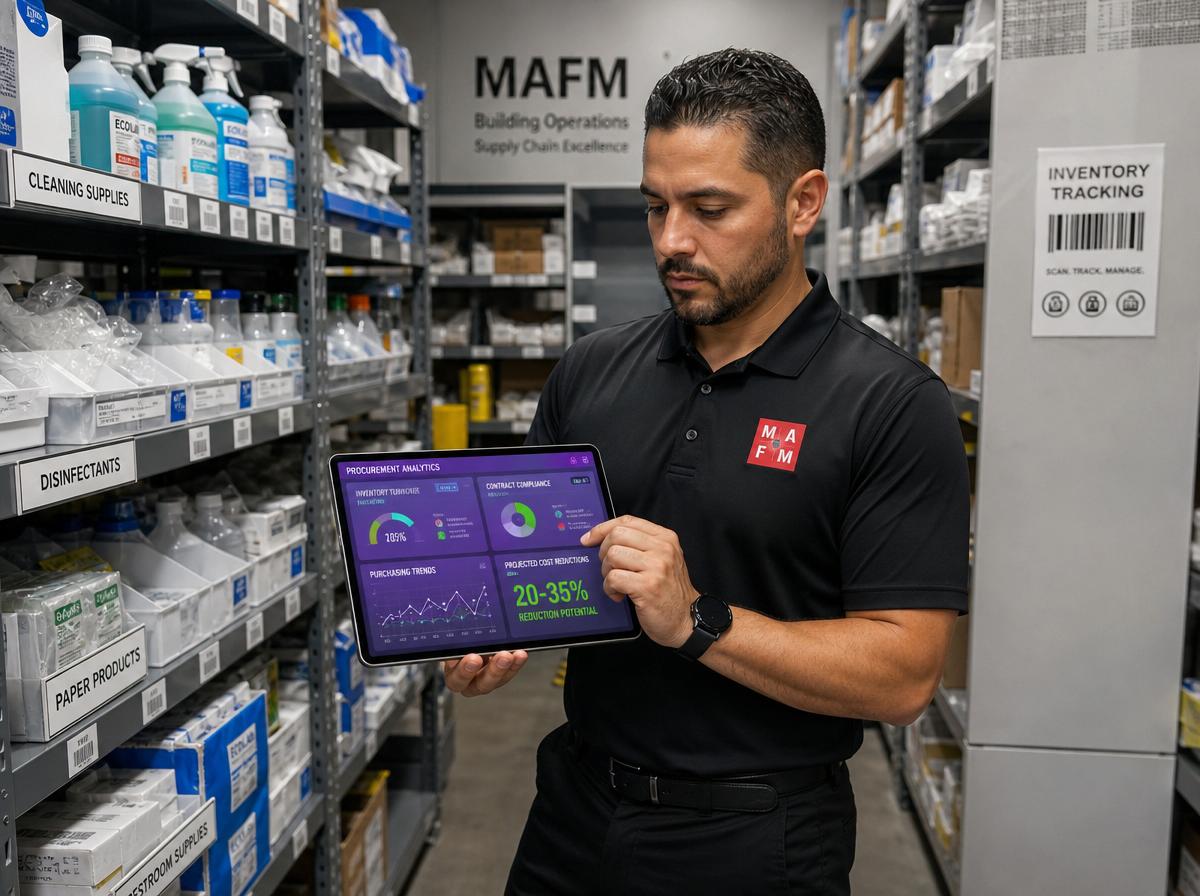
Supply Chain Cost Reduction for Facility Operations: How Silicon Valley Buildings Cut Supplies Spending by 20-35% Without Cutting Quality
Cleaning supplies, maintenance materials, paper products, liners, and sundry facility consumables represent 12–18% of most Silicon Valley commercial facility operating budgets. On a 50,000 square foot building spending $600,000 annually on total facility services, that is $72,000–$108,000 per year flowing through supply purchases.
This category is consistently the most under-managed major expense in facility operations. Unlike labor costs (where staffing hours are tracked, overtime is monitored, and productivity is measured) supply purchasing often operates with minimal oversight. Staff order when supplies run low, sometimes from the contracted distributor and sometimes from Amazon Prime when something is needed urgently. Usage rates are rarely measured. Par levels are set by intuition rather than data. And the difference between what supplies cost through the master agreement and what they cost on emergency one-off orders is never calculated.
The optimization opportunity is real and accessible. Buildings that apply systematic supply chain management to this category consistently achieve 20–35% cost reduction without any reduction in service quality, typically while improving service consistency through better supply availability and reducing waste from overuse.
The Supply Audit, Where You Actually Stand
Before optimizing, you need an accurate picture of your current supply spending, purchase patterns, and vendor relationships.
A supply audit covers three dimensions: what you buy, how you buy it, and how much you use.
What you buy requires a complete product inventory. List every chemical, paper product, liner, machine accessory, and maintenance consumable currently in use in the building. For each product, record the manufacturer and product name, the size and unit of measure, the current per-unit cost, the purchase frequency, and the vendor from whom it is purchased. This inventory typically reveals 30–50% more SKUs than facility managers believe they are purchasing, because staff make convenience purchases that never appear in procurement tracking.
How you buy it reveals whether your purchasing is consolidated through your master supply agreement or fragmented across multiple vendors and purchase channels. Fragmented purchasing is the primary cost driver in over-budget supply categories. A case of paper towels from your contracted distributor might cost $42. The same case purchased through an online retailer because you needed it the next day costs $58. Multiply fragmentation across dozens of products and dozens of purchases, and the cost premium compounds to thousands of dollars annually.
How much you use per month per unit of building area is the most revealing metric for identifying waste and over-ordering. Consumption norms for common products are well-established in the industry. A standard commercial office environment should consume approximately one case of hand soap per 1,000 square feet per month, one case of paper towels per 1,000 square feet per month, and one gallon of general purpose cleaner per 1,500 square feet per month. Buildings consuming significantly above these norms are experiencing either waste, theft, or misapplication.
Vendor Consolidation and Contract Optimization
Consolidating supply purchasing to one or two primary vendors unlocks volume pricing, administrative efficiency, and account management that fragmented purchasing cannot access.
The vendor selection process for facility supplies should evaluate pricing competitiveness across your full product list, not just the commodity items where prices are most visible. Vendors who offer competitive pricing on paper towels but premium pricing on specialty chemicals, floor care products, and maintenance materials can appear cost-effective on the commodity comparison while delivering above-market overall costs.
Request comprehensive pricing proposals from three qualified distributors, specifying your complete product list, estimated monthly volumes for each item, delivery frequency requirements, and service expectations including technical support, training, and product substitution consultation. Evaluate total annual cost across all products rather than category-by-category comparison, a vendor with marginally higher paper products pricing may more than offset that difference with significantly better pricing on the chemicals and floor care products that represent higher unit costs.
Annual supply agreements with volume price locks prevent the mid-year price increases that erode supply budgets on open-account purchasing. Negotiate a fixed-price agreement for your complete product list for the calendar year, with explicit provisions for new product additions, product substitution procedures when items become unavailable, and pricing adjustment mechanisms for extraordinary market disruptions.
Emergency purchase provisions in your master agreement establish a process for urgent one-off needs that maintains pricing controls. A clause specifying that emergency purchases below a defined dollar threshold can be charged to the master account at agreed-upon markup rates eliminates the full-retail pricing that convenience purchases otherwise generate.
Concentration and Dilution Control
The single largest source of supply waste in commercial cleaning operations is chemical misuse through incorrect concentration, and the most common misuse is over-concentration, where staff mix cleaning chemicals at ratios higher than necessary because they have no objective reference point.
A general purpose cleaner properly diluted at 1:64 delivers effective cleaning performance for standard surfaces. The same product mixed at 1:16, four times the concentration, may provide marginally faster cleaning on heavily soiled surfaces but costs four times as much per unit of cleaning work performed and potentially damages the surfaces being cleaned.
Without controlled dilution systems, your staff set their own concentration ratios based on personal preference, habit, and the idea that more concentrated must be more effective. The result is chemical waste that directly increases supply costs without improving cleaning outcomes.
Dilution control systems, either wall-mounted dispensers that meter water and concentrate at preset ratios or proportioning systems integrated into mop sinks, eliminate this variability. They ensure every batch of cleaning solution is mixed at the correct ratio regardless of which staff member is mixing it. Buildings that install dilution control systems typically reduce chemical consumption by 25–40% without any change in cleaning scope or quality.
Microfiber systems provide a complementary consumption reduction for paper-based cleaning consumables. Microfiber cloths and mop heads replace disposable paper wipes and traditional cotton mop heads at a fraction of the per-use cost. Buildings that have not yet converted their cleaning operations to microfiber are paying a significant per-cleaning-event cost premium that accumulates into meaningful annual waste.
Par Level Management and Inventory Control
Par level management, maintaining supply inventories at defined minimum and maximum levels, is the operational discipline that prevents both stockouts and over-purchasing.
Setting par levels requires calculating actual consumption rates for each product rather than estimating them. Track consumption for one full month by weighing or counting opening inventory, adding purchases, and subtracting ending inventory for each product. The resulting consumption rate, adjusted for safety stock appropriate to your delivery lead time, becomes your minimum par level. Your maximum par level is typically two to three weeks of consumption, enough to buffer against supply disruption without creating storage burden.
Monthly physical inventory counts verify that actual stock levels match expected levels based on purchases and usage. Significant discrepancies between expected and actual inventory signal either tracking errors, waste, or theft, each requiring investigation and response.
FIFO (First In, First Out) product rotation ensures that older stock is used before newly received product, preventing the shelf-life deterioration that allows products to expire before use. Many cleaning chemicals have shelf lives of 12–24 months after opening, and products stored improperly can lose effectiveness before reaching their labeled expiration date.
Product Rationalization
The supply audit typically reveals multiple products performing similar or identical functions, a proliferation of general purpose cleaners, multiple floor finish products with different specifications, various restroom disinfectants that all meet the same performance criteria.
Product rationalization reduces the SKU count to the minimum set of products that covers all required applications without redundancy. A rationalized product lineup has one general purpose cleaner, one heavy-duty degreaser, one disinfectant, one floor finish, one restroom cleaner, one glass cleaner, and the paper and liner products required. Each product is selected to perform effectively across the range of applications where similar products are currently used.
Rationalization reduces purchasing complexity, enables higher volume on fewer SKUs, simplifies training, and eliminates the confusion about which product to use for which application that drives incorrect product selection and waste.
The process requires input from both cleaning staff, who know which products actually work in the building's specific conditions, and your supply distributor, who can recommend products from their catalog that perform across multiple application requirements.
Conclusion
Supply chain cost reduction is the facility cost optimization category that receives the least attention relative to the savings it delivers. The combination of supply audit, vendor consolidation, concentration control, par level management, and product rationalization consistently delivers 20–35% cost reduction, on a $90,000 supply budget, that is $18,000–$31,500 in annual savings from a category that most buildings manage by inertia.
Start with a supply audit this month. Count and list every product in every janitorial closet and maintenance storage area. Calculate your monthly consumption rates. Compare your pricing against current market alternatives. The optimization opportunities are almost certainly there, you just have not looked for them yet.
MAFM applies rigorous supply chain management to every property we serve, consistently delivering below-market supply costs without quality compromise. Contact us to audit your current supply program.
Schedule your consultation: Contact MAFM.PRO
Ready to Optimize Your Facilities?
MAFM offers comprehensive facility management solutions tailored to your business needs.
Get in Touch