Benchmarking Your Facility Costs Against Silicon Valley Market Standards: Are You Overpaying or Getting What You Pay For?
Benchmarking Your Facility Costs Against Silicon Valley Market Standards: Are You Overpaying or Getting What You Pay For?
Every facility manager believes their operation is reasonably cost-efficient. Very few can demonstrate it with data. The absence of meaningful benchmarks is the most common gap in commercial facility financial management, and it leaves property owners, asset managers, and CFOs unable to distinguish between a facility program that is genuinely cost-effective and one that is simply unexposed to competitive scrutiny.
Benchmarking changes this dynamic fundamentally. When you can show that your building's janitorial cost per cleanable square foot is 11% below the Silicon Valley Class A office median, that your HVAC maintenance cost per ton of cooling capacity is within 5% of the industry benchmark, and that your energy use intensity is in the top quartile of comparable buildings, you have demonstrated operational competency with data rather than asserted it with confidence.
Conversely, when benchmarking reveals that your overall operating cost per square foot runs 18% above the peer median without corresponding quality superiority, you have identified the starting point for a cost optimization initiative that could generate hundreds of thousands in annual savings.
Here is the benchmarking framework that gives Silicon Valley facility managers the market context to evaluate their spending honestly.
The Benchmark Data Sources
Reliable facility cost benchmarking requires reference data from comparable buildings, and the quality of benchmarking depends directly on the quality of the reference dataset.
BOMA's Experience Exchange Report (EER) is the gold standard for commercial office building operating cost benchmarking. Published annually, the EER aggregates operating expense data from thousands of commercial buildings across the country and reports median, quartile, and mean statistics by building class, size, geography, and lease structure. The Pacific region data, which includes the Bay Area, provides the most geographically relevant comparison for Silicon Valley properties.
BOMA EER benchmarks cover all major operating expense categories: cleaning, maintenance, utilities, roads and grounds, security, administrative, and total operating cost. The 2025 data, the most recent publication, shows Pacific region Class A office buildings with total operating costs ranging from $8.50–$14.20 per square foot annually, with cleaning costs of $1.45–$2.85 per square foot and utility costs of $2.10–$4.80 per square foot depending on building configuration and climate zone.
IFMA's Facility Cost and Staffing Report provides benchmarks specific to facility management staffing and service delivery costs rather than total building operating expenses. This report is particularly useful for benchmarking cleaning costs, maintenance staffing ratios, and FM management overhead against peer facilities.
ENERGY STAR Portfolio Manager provides automatic benchmarking of your building's energy use intensity against comparable buildings in its database, buildings of similar type, size, climate zone, and occupancy profile. A Portfolio Manager ENERGY STAR score of 75 or higher (75th percentile or better for energy performance) indicates strong energy management relative to peers.
The Core Benchmarks by Category
These specific metrics, with their Silicon Valley Class A office benchmarks, form the comparison set that makes peer analysis meaningful.
Total facility operating cost per rentable square foot is the master metric. The Silicon Valley Class A office median runs $10.50–$12.50 per rentable square foot annually for buildings in the 50,000–200,000 square foot range. Buildings below $9.50/RSF are likely to be under-serviced or deferred in maintenance. Buildings above $14.00/RSF without commensurate service quality evidence are likely candidates for cost optimization.
Cleaning cost per cleanable square foot measures janitorial and maintenance cleaning efficiency specifically. The Silicon Valley benchmark range runs $1.65–$2.45 per cleanable square foot annually for standard Class A service levels. Properties delivering enhanced service frequencies (more frequent restroom cycles, day porter coverage, higher-specification floor care programs) appropriately run in the $2.20–$3.00 range.
Energy use intensity (EUI) in kBTU per square foot per year benchmarks energy efficiency relative to similar buildings. Silicon Valley Class A office buildings with standard occupancy and no data center load benchmark at 55–80 kBTU/sq ft/year. Buildings above 90 have meaningful energy efficiency opportunity. Buildings below 50 are strong performers.
Electricity cost per square foot separates the energy efficiency story from the rate structure story. A building with a low EUI but a poor rate structure may have comparable electricity costs to a building with a higher EUI on an optimized rate structure. This metric reveals the combined result of efficiency and rate management.
Maintenance cost per square foot covers planned and reactive maintenance combined. Silicon Valley benchmarks run $1.20–$2.10 per square foot annually for standard commercial office buildings, with the appropriate level depending on building age, system complexity, and tenant profile. The ratio of planned to reactive maintenance within this figure matters as much as the total, a $1.50/sq ft maintenance cost that is 70% planned indicates a different management quality than the same cost that is 30% planned.
Staffing ratios for cleaning operations benchmark in square feet of cleanable area per full-time equivalent cleaning position. Silicon Valley Class A office benchmarks run 18,000–28,000 cleanable square feet per FTE for standard commercial service specifications. Ratios below 15,000 sq ft per FTE indicate potential overstaffing or inefficiency. Ratios above 32,000 sq ft per FTE suggest understaffing risk that affects quality.
Interpreting Benchmark Gaps
Being above or below a benchmark is not automatically good or bad, the interpretation depends on what the gap represents.
Favorable gaps, your costs are below the benchmark, require explanation before celebration. A cleaning cost 25% below the market median might mean you have an exceptionally efficient janitorial program. It might also mean you have an understaffed program delivering below-standard cleaning quality. Pull your inspection scores and tenant complaint data alongside the cost benchmark to distinguish genuine efficiency from hidden service deterioration.
Unfavorable gaps, your costs exceed the benchmark, require root cause diagnosis before optimization. A maintenance cost 30% above the median might mean you have an aging building requiring proportionally higher maintenance investment. It might mean you have a reactive maintenance culture that is paying the 3–5x cost premium that emergency repairs carry. It might mean your vendor rates are above market. The correction strategy is completely different for each cause.
Mixed benchmark profiles are the norm. Most buildings perform well against some benchmarks and poorly against others, creating a profile of specific opportunities rather than a simple "good" or "bad" overall assessment. A building with excellent cleaning cost efficiency, average maintenance performance, and poor energy costs has a specific optimization focus: energy cost reduction.
Building Your Benchmark Comparison Document
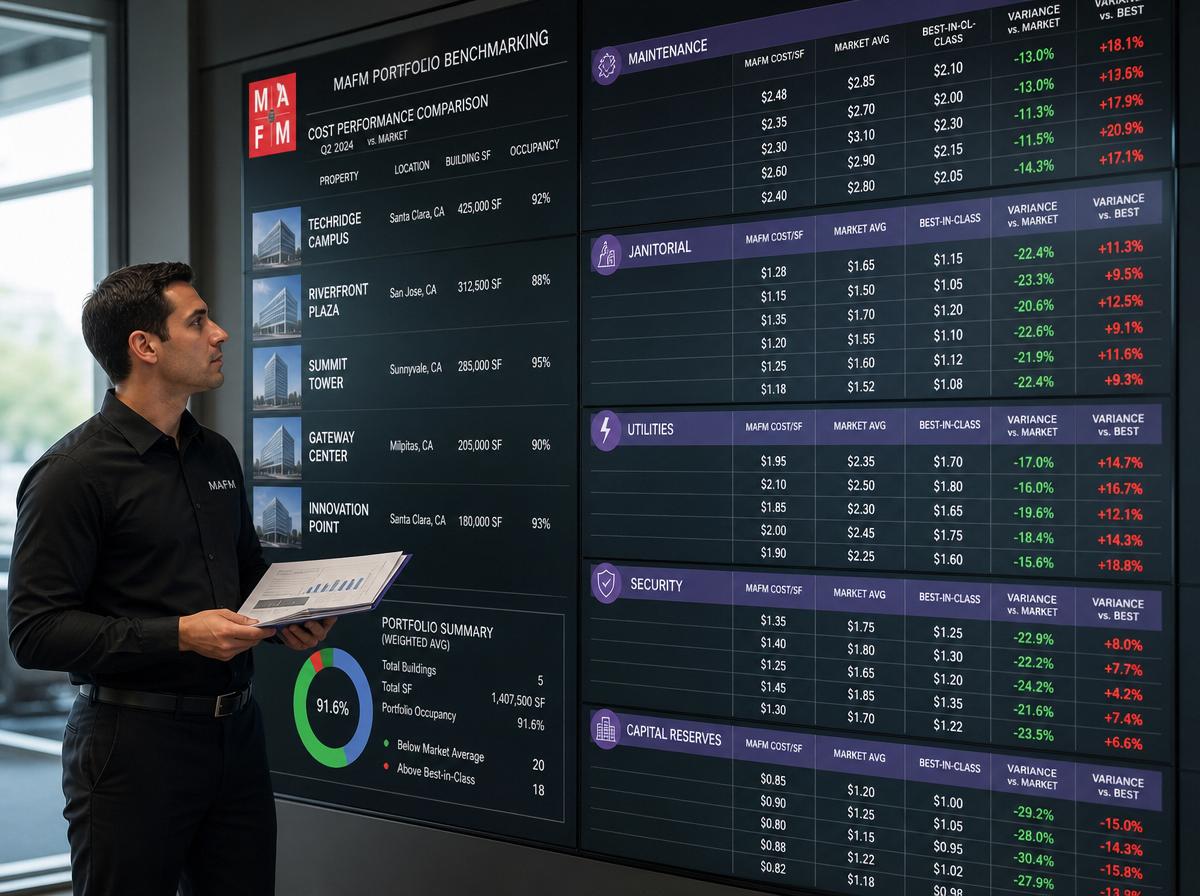
The benchmark analysis should produce a clean, visual comparison document that can be presented to ownership and stakeholders as evidence of financial management competency.
Format the comparison as a table with your building's current performance in one column and the market benchmark range in the adjacent column, with a third column showing the variance and a fourth column flagging whether each metric is Strong, Acceptable, or Opportunity.
Add a summary narrative that contextualizes the numbers. If your cleaning cost is above benchmark because you provide enhanced service frequencies that your tech tenants specifically requested, that context matters. If your energy cost is above benchmark because your building has an unusually high proportion of server room space that drives energy consumption, that distinction changes the optimization conversation.
Update the benchmark document annually as new BOMA EER data becomes available and as your own building's performance changes. The trend in your benchmarks over multiple years is as revealing as the current position, a building that has improved its EUI from 95 to 72 over three years while maintaining cleaning cost benchmarks is demonstrably improving operational efficiency regardless of where it sits relative to peers at any single point in time.
Using Benchmarks in Vendor Negotiations
Benchmark data is among the most powerful tools available in vendor contract negotiations, but only when deployed correctly.
The correct deployment is as a market context reference, not as a blunt instrument. A vendor told that you expect them to hit the 25th percentile of the benchmark distribution in a negotiation will either refuse, discount their service quality to meet the number, or both. A vendor shown where their pricing sits relative to the market median and asked to explain the gap engages in a productive conversation about what value justifies any premium above market.
Prepare a vendor benchmark packet for each major service renewal that shows the market median for comparable services in Silicon Valley, your building's specific parameters that affect appropriate benchmarks, and where the vendor's current pricing falls relative to those benchmarks. This packet makes the negotiation data-driven rather than positional and produces better outcomes than either pure price pressure or uninformed acceptance of proposed rates.
Conclusion
Benchmarking converts facility cost management from an internal exercise into a market-oriented discipline. The numbers that matter are not just whether you are on budget, they are whether your budget is competitive, your spending is efficient, and your operational investments are generating returns comparable to what similar buildings achieve.
Pull your BOMA EER data this week. Run the comparison against your five-month actuals annualized. Build your benchmark document. And identify the two or three opportunities where closing the gap between your current performance and the market benchmark would generate the most significant financial improvement.
MAFM benchmarks every property we manage against current market data, ensuring our clients always know where their buildings stand financially and operationally. Contact us for a facility cost benchmarking analysis.
Schedule your consultation: Contact MAFM.PRO
Ready to Optimize Your Facilities?
MAFM offers comprehensive facility management solutions tailored to your business needs.
Get in Touch